Attempt to further improve the diffusion standard statistics#
The denoising strategy that I used to improve the diffusion standard statistics (see my last post), required the estimation of the noise standard deviation (sigma). As a first approach, I used a simple sigma estimation procedure that was specifically developed for T1-weighted images. Thus, this might not be the most adequate approach for diffusion-weighted images.
Particularly, I noticed that sigma estimates had a dependency on the b-values (smaller b-values were related to higher sigma). Example of computed sigma for given b-values are shown below:
b-value = 0 => sigma around 810
b-value = 200 => sigma around 510
b-value = 400 => sigma around 390
b-value = 1000 => sigma around 268
b-value = 2000 => sigma around 175
Comparing the original diffusion-weighted images with the denoised versions, I notice that, for the smaller b-values, some image texture was present when computing the difference between original and denoised version of the image. This suggests that sigma values for smaller b-values are overestimated.
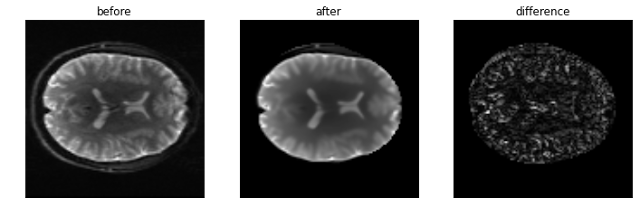
Figure 1. - Diffusion-weighted image with b-values set to 0. Left panel shows the image before being denoised while the middle panel shows the denoised image. The difference between both images is shown in left. Some image structure can be identified on the image difference, which suggest that important information is being removed on the denoising process.#
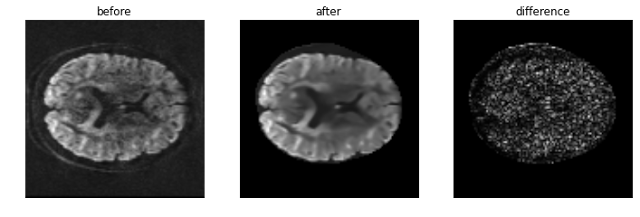
Figure 2. - Diffusion-weighted image with b-values set to 2000. Left panels show the image before being denoised while the middle panels shows the denoised image. The difference between both images is shown in left. Brain structure is not significantly identified on the image difference.#
PIESNO#
Given the issue mentioned above, I tried to replace the noise estimation procedure with a technique specifically developed for diffusion-weighted images - a technique called PIESNO. This technique can be imported and used from DIPY using the following commands:
from dipy.denoise.noise_estimate import piesno
sigma, background_mask = piesno(data, N=4, return_mask=True)
The noise standard given by PIESNO for all axial images was around 156. As expected this value is smaller than the previous sigma estimates suggesting that these were indeed overestimated.
Despite this value seems to be the most accurate estimate for the denoising procedure, I noticed that only a small amount of background voxels, used to compute sigma, was automatically detected by PIESNO.
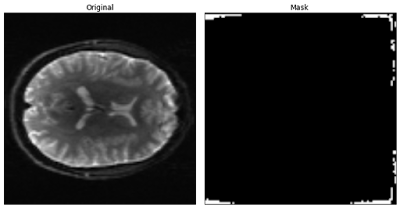
Figure 3 - Background voxels detected by PIESNO. These voxels were the ones used to estimate the noise standard deviation.#
Computing again the difference between the original and denoised version of the data. I also notice that the denoising procedure performance was still dependent on the b-value. In particular, for a b-value=0 the procedure seems only to denoise the middle of the image. Since sigma was maintained constant, this dependency with the b-value seem to be caused by the denoising algorithm itself.
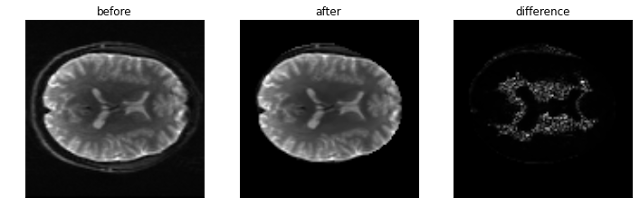
Figure 4. - Diffusion-weighted image with b-values set to 0. Left panels shows the image before being denoised while the middle panels shows the denoised image. Noise estimation for the denoising procedure is now done using PIESNO. The difference between both images is shown in left. Some image structure can be identified on the image difference, which suggest that important information is being removed on the denoising process.#
Figure 5. - Diffusion-weighted image with b-values set to 2000. Left panels shows the image before being denoised while the middle panels shows the denoised image. Noise estimation for the denoising procedure is now done using PIESNO. The difference between both images is shown in left. Brain structure is not significantly identified on the image difference.#
Below are the final versions of the kurtosis standard measures obtained after adjusting the sigma of the denoising procedure:
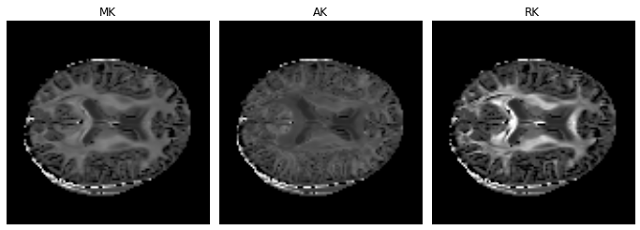
Figure 6 - Real brain parameter maps of the mean kurtosis (MK), axial kurtosis (AK), and radial kurtosis (RK) obtain from a HCP-like dataset using the DKI module. These are the maps specific to DKI. The dataset for these reconstructions was kindly supplied by Valabregue Romain, CENIR, ICM, Paris.#
Noise artifacts are present when PIESNO is used, therefore for the DKI reconstruction I decided to keep the previous denoising approach as default.